Keep Your Trend Analysis Simple: Use the SMA!
A simple moving average (SMA) is a powerful technical analysis tool that can greatly benefit traders and investors in the stock market. By calculating the average of a selected range of prices, usually closing prices, the SMA provides valuable insights into price trends. Whether you are a seasoned trader or just starting out, incorporating the SMA into your analysis can help you make more informed decisions and improve your market prediction accuracy.
With the SMA, you can quickly and easily determine if an asset price will continue or reverse a bull or bear trend. By smoothing out volatility and highlighting price trends, the SMA allows you to identify potential support and resistance levels. Additionally, the SMA can be enhanced as an exponential moving average (EMA), which gives more weight to recent price action.
Key Takeaways:
- The SMA is a simple and effective tool for trend analysis in the stock market.
- It calculates the average of a selected range of prices, usually closing prices, by the number of periods in that range.
- The SMA helps determine if an asset price will continue or reverse a bull or bear trend.
- It can be enhanced as an exponential moving average (EMA), which gives more weight to recent price action.
- Incorporating the SMA into your analysis can improve market prediction accuracy and inform trading decisions.
Understanding Simple Moving Average (SMA)
A simple moving average (SMA) is a widely used technical analysis tool that helps traders understand the price trends of a security. By calculating the average of a selected range of prices over a specific number of periods, usually closing prices, the SMA smooths out volatility and provides a clearer view of the price trend. It is an arithmetic moving average, calculated by adding recent prices and then dividing that figure by the number of time periods in the calculation average.


The SMA can be customized for different time periods, allowing traders to analyze short-term or long-term trends. A longer-term SMA, such as the popular 200-day SMA, provides a smoother representation of the price trend, making it useful for identifying long-term trends. On the other hand, a shorter-term SMA is more sensitive to recent price movements, making it valuable for capturing short-term trends.
Traders often use the SMA in conjunction with other technical indicators to confirm price trends. For example, comparing two moving averages with different time frames, such as the 50-day and 200-day SMAs, can help determine if an asset is in an uptrend or downtrend. When the shorter-term SMA crosses above the longer-term SMA, it is considered a bullish signal, indicating potential for a market rally. Conversely, if the shorter-term SMA crosses below the longer-term SMA, it is interpreted as a bearish signal, suggesting a potential downtrend.
Understanding Simple Moving Average (SMA)
The simple moving average (SMA) is a technical analysis tool that calculates the average of a selected range of prices over a specific number of periods. It is an effective way to smooth out the volatility in the price data and identify the overall price trend of a security. By using the SMA, traders can analyze short-term or long-term trends in the stock market, making it a versatile tool for trend analysis.
To calculate the SMA, traders add up the closing prices of a security over a specific number of periods and then divide that figure by the number of periods. The resulting SMA line is then plotted on a price chart, providing a smoothed representation of the price trend. The SMA can be customized for different time periods, allowing traders to focus on short-term or long-term trends.
Traders often use the SMA in combination with other technical indicators to confirm price trends. For example, comparing two moving averages with different time frames, such as the 50-day and 200-day SMAs, can help identify the overall direction of the price trend. When the shorter-term SMA crosses above the longer-term SMA, it is considered a bullish signal, indicating potential for a market rally. Conversely, if the shorter-term SMA crosses below the longer-term SMA, it is interpreted as a bearish signal, suggesting a potential downtrend.
| Period | Closing Price | SMA Calculation |
|---|---|---|
| 1 | 10.00 | 10.00 |
| 2 | 12.00 | 11.00 |
| 3 | 11.50 | 11.50 |
| 4 | 13.00 | 11.88 |
| 5 | 10.50 | 11.80 |
In the example table above, we have calculated the SMA for a range of closing prices over five periods. The SMA calculation for each period is obtained by adding up the closing prices and dividing the sum by the number of periods. It is important to note that the SMA is a lagging indicator, as it is based on historical price data and may not accurately predict future price movements.

Analytical Significance of Simple Moving Average
The simple moving average (SMA) is a powerful tool in technical analysis for analyzing price trends and making informed trading decisions. By calculating the average of a selected range of prices over a specific period, the SMA helps identify the direction of the price trend and potential changes in trend. Traders often compare different time frames of moving averages to confirm an uptrend or downtrend.
Importance of SMA in Price Trend Analysis
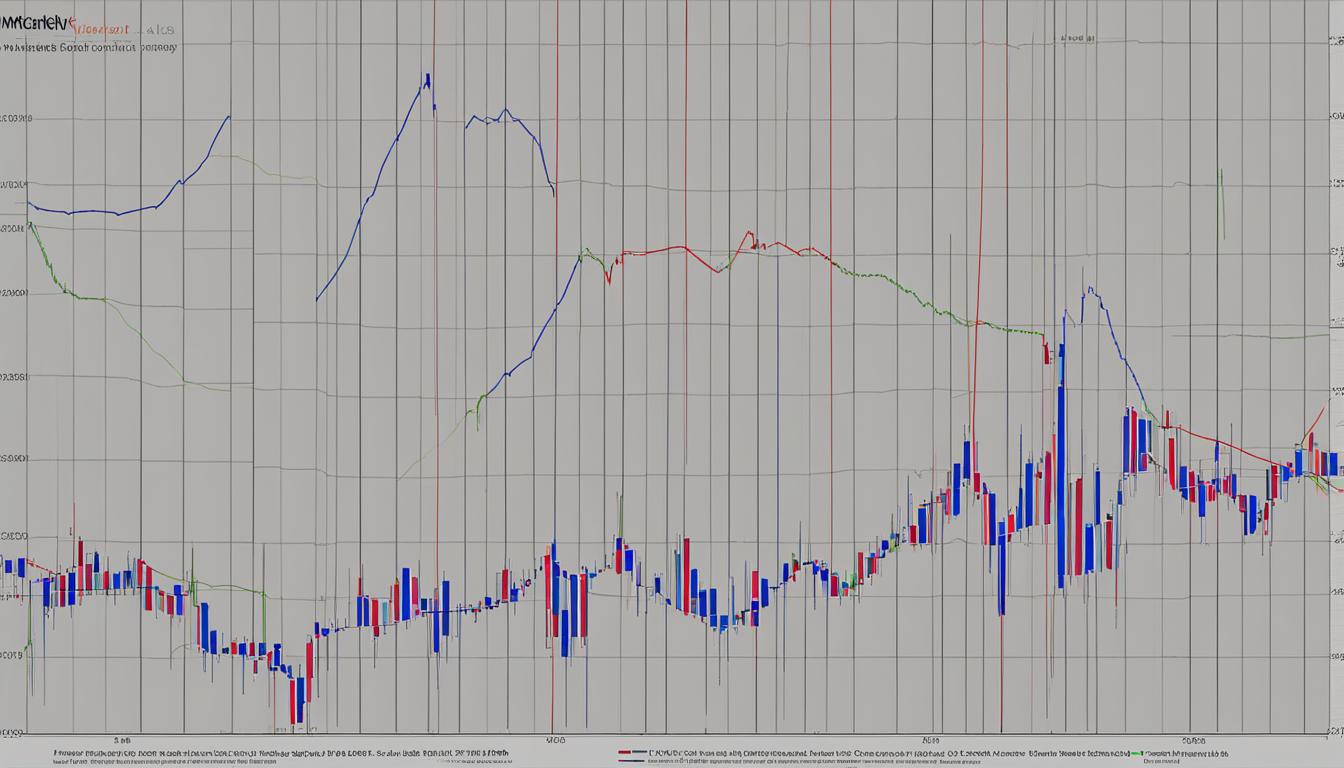
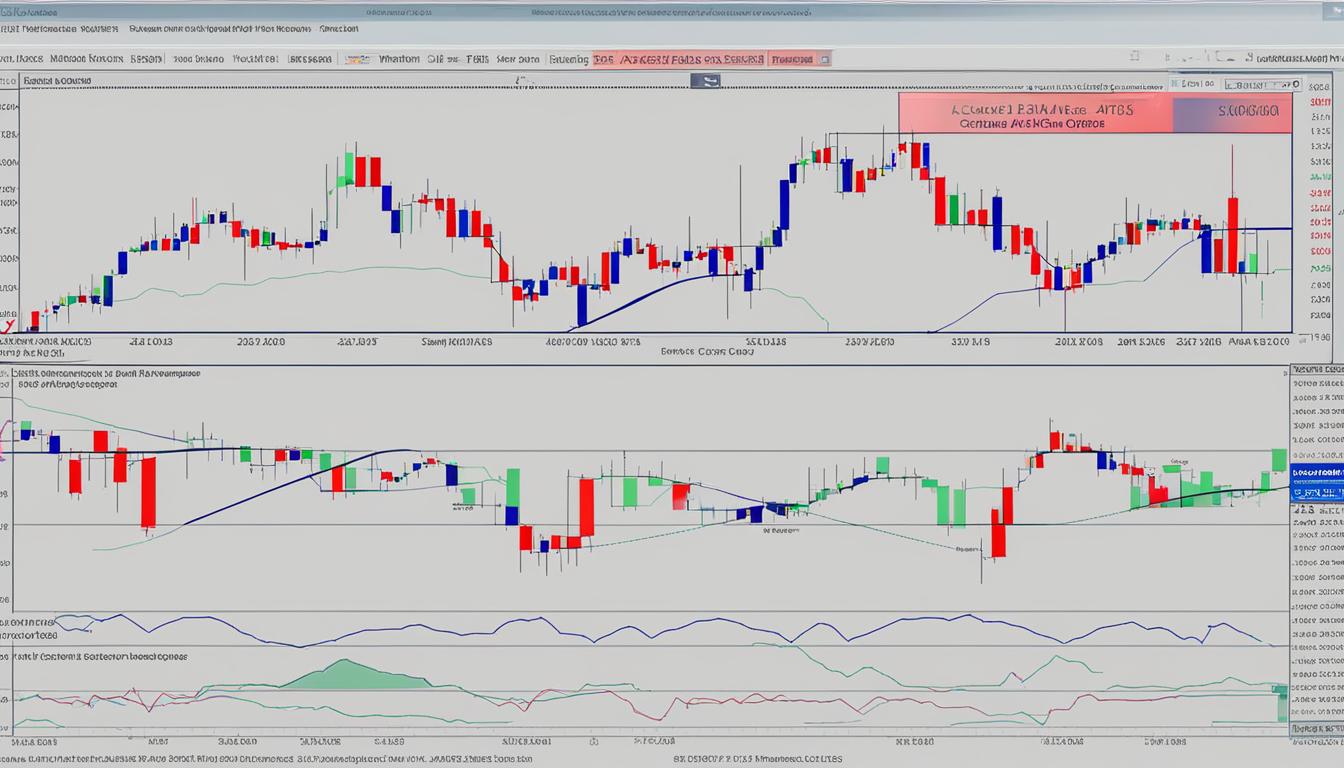
The SMA is widely used by investors and traders to analyze price trends in the stock market. By plotting the SMA on a price chart, traders can easily visualize the direction of the trend. When the price is above the SMA, it indicates an uptrend, while a price below the SMA suggests a downtrend. The SMA can also act as a support or resistance level, helping traders identify potential entry and exit points.
Additionally, traders often compare two different SMAs, such as the 50-day SMA and the 200-day SMA, to confirm a trend. When the shorter-term SMA crosses above the longer-term SMA, it is considered a bullish signal, indicating a potential uptrend. Conversely, a bearish signal occurs when the shorter-term SMA crosses below the longer-term SMA, suggesting a potential downtrend.
Using SMA in Moving Average Calculation
The SMA is calculated by adding up the closing prices over a specific period and dividing the sum by the number of periods. This smooths out price volatility and provides a clearer view of the price trend. Traders can customize the time period of the SMA based on their trading strategy and the asset they are analyzing. It is important to note that the SMA is a lagging indicator, as it is based on historical data.
| Frequency | Calculation |
|---|---|
| Daily | Sum of Closing Prices of the Last ‘n’ Days / ‘n’ |
| Weekly | Sum of Closing Prices of the Last ‘n’ Weeks / ‘n’ |
| Monthly | Sum of Closing Prices of the Last ‘n’ Months / ‘n’ |
Traders can use the SMA as a standalone indicator or in conjunction with other technical analysis tools to enhance their market analysis. However, it is important to consider the limitations of the SMA and incorporate other factors, such as volume and market sentiment, for a comprehensive analysis.

Overall, the SMA is a valuable tool for traders and investors to analyze price trends and make informed decisions. By understanding its analytical significance and incorporating it into their technical analysis, traders can gain valuable insights into market trends and develop effective trading strategies.
Limitations of Simple Moving Average
The Simple Moving Average (SMA) is a widely used technical analysis tool that helps traders identify price trends and make predictions. However, it is important to understand the limitations of the SMA in order to use it effectively.
Uncertainty in Weight Placement
One of the limitations of the SMA is the uncertainty surrounding the placement of weight on different data points. Traders may have different beliefs about the significance of certain dates and may assign different weights to them. This subjectivity can affect the accuracy of the SMA in predicting future price movements.
Reliance on Historical Data
The SMA relies solely on historical price data, making it a lagging indicator. While historical data can provide insights into past price trends, markets are believed to be efficient, meaning that current prices already reflect all available information. Therefore, relying solely on historical data may not accurately predict future price movements.
Consideration of Other Technical Indicators
While the SMA is a valuable tool in technical analysis, it is important to consider other technical indicators for a comprehensive analysis. Combining the SMA with other indicators such as volume analysis, oscillators, or trendlines can provide a more complete picture of market trends and enhance the accuracy of predictions.
| Limitations of Simple Moving Average | Explanation |
|---|---|
| Uncertainty in Weight Placement | Traders may assign different weights to certain dates, affecting the accuracy of SMA predictions. |
| Reliance on Historical Data | The SMA is based solely on historical data, which may not accurately predict future price movements. |
| Consideration of Other Technical Indicators | Using other indicators in conjunction with the SMA can provide a more comprehensive analysis of market trends. |
How to Use Simple Moving Averages in Technical Analysis
Simple moving averages (SMAs) are a valuable tool for traders in technical analysis to analyze price trends and develop effective trading strategies. By charting the long-term trajectory of a stock or security, SMAs help traders focus on the overall trend while filtering out day-to-day price fluctuations. Here’s how you can utilize SMAs in your technical analysis:
Identifying Trend Reversals
One common use of SMAs is to identify trend reversals. By comparing medium- and long-term SMAs, you can gain insights into potential changes in market direction. For instance, if the 200-day SMA falls below the 50-day SMA, it is often interpreted as a bearish signal, indicating a potential downtrend. Conversely, a “golden cross” occurs when a short-term SMA crosses above a long-term SMA, suggesting a market rally may be on the horizon.
Support and Resistance Levels
SMAs can also help identify key support and resistance levels. Support levels are price levels where a security tends to reverse its downtrend and start rising, while resistance levels are price levels that tend to stall a security’s upward momentum. By analyzing price action relative to the SMA, traders can identify these levels and make more informed decisions on when to buy or sell.
Integration with Trading Strategies
SMAs can be incorporated into various trading strategies. For example, you can develop a breakout strategy where you enter a trade when the price breaks above a specific SMA. Alternatively, you can use SMAs to confirm the validity of other technical indicators. If an indicator generates a bullish signal, but the SMA does not support it, it may be a sign to exercise caution. Integrating SMAs into your trading strategies can help improve decision-making and increase the likelihood of successful trades.
Remember, while SMAs can provide valuable insights, it is important to consider other technical indicators and conduct comprehensive analysis. By combining various tools and techniques, traders can gain a more holistic picture of market trends and make more informed trading decisions.

What Is a Moving Average (MA)?
A moving average (MA) is a widely used stock indicator in technical analysis. It is used to smooth out price data by creating a constantly updated average price over a specific period. MAs are effective tools for identifying trend direction, support and resistance levels in price data. There are different types of moving averages, including simple moving averages (SMA) and exponential moving averages (EMA), each with its own calculation method and characteristics.
The SMA is a basic type of MA that calculates the arithmetic mean of a given set of prices over a specific period. It is customizable to different time periods and provides a smoother view of price trends. On the other hand, the EMA gives more weight to recent prices, making it more responsive to new information. Traders often prefer the EMA for its timely indicators of price trends.
Moving averages are considered lagging indicators as they are based on past prices. They help traders identify key levels of support and resistance, which can be used to make trading decisions. By analyzing the relationship between different moving averages, traders can gain insights into potential trend reversals, confirming momentum and predicting future price movements.

Types of Moving Averages
There are different types of moving averages that traders can choose from based on their trading objectives. The SMA is a commonly used moving average that provides a simple and straightforward calculation of the average price over a specified time period. The EMA, on the other hand, gives more weight to recent prices, making it more responsive to short-term price movements.
Traders can experiment with different lengths of moving averages to find the most suitable one for their trading strategy. Shorter moving averages, such as the 10-day or 20-day SMA, are more sensitive to price changes and can provide more frequent trading signals. Longer moving averages, such as the 50-day or 200-day SMA, are smoother and can be used to identify long-term trends.
| Type of Moving Average | Description |
|---|---|
| Simple Moving Average (SMA) | Calculates the arithmetic mean of prices over a specific period. Provides a smoother view of price trends. |
| Exponential Moving Average (EMA) | Gives more weight to recent prices. More responsive to short-term price movements. |
Using moving averages in technical analysis can help traders make more informed trading decisions. By understanding the different types of moving averages and their characteristics, traders can effectively analyze price data, identify trends, and develop trading strategies.
Types of Moving Averages
When it comes to technical analysis, moving averages (MA) are an essential tool for understanding price trends and making informed trading decisions. There are two main types of moving averages: the simple moving average (SMA) and the exponential moving average (EMA).
The SMA is a popular choice among traders due to its simplicity and versatility. It calculates the average price of an asset over a specific time period, providing a smooth line that helps identify trend direction. The SMA is customizable, allowing traders to adjust the time period to suit their trading objectives. For example, a shorter-term SMA (e.g., 20-day) responds more quickly to price changes, while a longer-term SMA (e.g., 200-day) provides a more gradual trend line.
On the other hand, the EMA places more weight on recent price data, making it more responsive to market changes. This makes the EMA particularly useful for short-term traders who want to capture more immediate price movements. The EMA is calculated using a complex formula that assigns greater importance to recent prices, resulting in a line that closely tracks current market conditions.
The Difference Between SMA and EMA
The main difference between the SMA and EMA lies in how they respond to price changes. While the SMA provides a smoother line that lags behind recent price movements, the EMA reacts more quickly to market fluctuations. Traders should choose the type of moving average that aligns with their trading strategy and time horizon.
Example:
“The SMA helped me identify a long-term uptrend in a stock I was considering. By analyzing the 200-day SMA, I gained confidence in the stock’s positive trajectory and made a profitable investment.” – Jane Doe, experienced trader
| Type | Calculation | Responsiveness |
|---|---|---|
| Simple Moving Average (SMA) | Sum of prices / Number of periods | Smooth, lagging |
| Exponential Moving Average (EMA) | Weighted average of recent prices | Responsive, quick |
Each type of moving average has its strengths and weaknesses, and traders may choose to use both in combination with other technical indicators for a comprehensive analysis. The key is to understand how each type functions and adapt it to suit one’s trading strategy and objectives.

Conclusion
The simple moving average (SMA) is a widely used technical analysis tool that provides valuable insights into price trends and supports the development of effective trading strategies. By calculating the average of closing prices over a specified period, the SMA helps traders identify the direction of the market and potential reversal points.
The SMA is particularly useful in identifying support and resistance levels, which are crucial for making informed trading decisions. Traders can also utilize SMAs to confirm momentum and predict future price movements. However, it is important to recognize the limitations of the SMA and supplement its analysis with other technical indicators for a comprehensive assessment of the market.
Traders should keep their trend analysis simple by incorporating the SMA into their strategies. By understanding the significance of SMAs and their role in trend analysis, traders can enhance their market prediction accuracy and gain a competitive edge in the financial markets.
FAQ
What is a simple moving average (SMA)?
A simple moving average is a technical indicator that calculates the average of a selected range of prices by the number of periods in that range. It is used for trend analysis in the stock market.
How is a simple moving average calculated?
A simple moving average is calculated by adding recent prices and then dividing that figure by the number of time periods in the calculation average.
What is the difference between a simple moving average and an exponential moving average?
A simple moving average is an arithmetic mean of prices, while an exponential moving average gives more weight to recent prices. The exponential moving average is more responsive to new information.
What is the significance of a 200-day simple moving average?
The 200-day simple moving average is one of the most popular SMAs in stock market analysis. It is widely followed by investors and traders as an important trading signal.
What are the limitations of a simple moving average?
The simple moving average relies solely on historical data and may not accurately predict future price movements. It is unclear whether more weight should be placed on recent data or more distant data. Different traders may have different beliefs about the significance of certain dates.
How can simple moving averages be used in technical analysis?
Simple moving averages can be used to determine price trends, identify support and resistance levels, and confirm momentum. Traders can use them to make predictions and develop trading strategies.
What is a moving average (MA)?
A moving average is a stock indicator commonly used in technical analysis to smooth out price data by creating a constantly updated average price. It helps identify trend direction and support and resistance levels.
What are the types of moving averages?
The two main types of moving averages are the simple moving average (SMA) and the exponential moving average (EMA). The SMA calculates the arithmetic mean of a given set of values over a specific period, while the EMA gives more weight to recent prices.