How To Identify Overbought Or Oversold Market Conditions
Two key terms that often come up are ‘overbought’ and ‘oversold’. These terms refer to market conditions that are ripe for a reversal, providing potential opportunities for savvy investors. This article will guide you on understanding these situations and how to identify them using various indicators.
What Are Overbought and Oversold Conditions?
Such conditions indicate when an asset has reached extreme price levels, either overpricing or underpricing it relative to its current value:
- An overbought market condition occurs when an asset’s trading value exceeds its intrinsic or fair value due to recent or short-term price movements.
- Conversely, an oversold market condition arises when an asset’s price has fallen sharply and is expected to bounce back.
| Market Level | Price Movement | Investor Behavior |
|---|---|---|
| Overbought | Consistent upward movement | Excessive demand |
| Oversold | Prolonged downward movement | Excessive selling pressure |


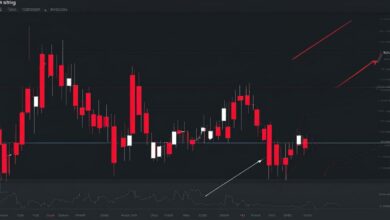
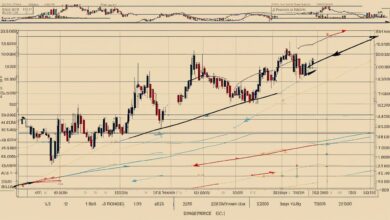
Identifying Overbought and Oversold Conditions
Several tools and indicators can help identify overbought and oversold conditions.
1. Relative Strength Index (RSI)
The RSI is a momentum indicator that measures the speed and magnitude of a security’s recent price changes. It operates on a scale of 0 to 100.
- An RSI level of 70 or above is considered overbought, indicating a long run of successively higher prices.
- On the other hand, an RSI level of 30 or below is considered oversold.
2. Stochastic Oscillator
On a stochastic oscillator graph, readings within the 80-100 range are considered overbought, while readings between 0-20 are considered oversold.
| Technical Indicator | Overbought Level | Oversold Level |
|---|---|---|
| Relative Strength Index (RSI) | Above 70 | Below 30 |
| Stochastic Oscillator | Above 80 | Below 20 |

“The stochastic oscillator can also be a useful tool for identifying divergences in stock price movement,” says our expert analyst. “When a stock’s price reaches a new high but the stochastic oscillator fails to surpass its previous high, it could be a sign of a weakening trend. Conversely, if a stock’s price reaches a new low but the stochastic oscillator fails to reach a new low, it could indicate a potential trend reversal.”
3. Bollinger Bands
- When the price breaks below the lowest of the three Bollinger Bands, it indicates oversold conditions that may lead to a bounce-back in price.
- When the price breaks above the highest of the bands, it indicates overbought conditions.
Key Takeaways
- Overbought and oversold conditions are market states that indicate potential reversals.
- The Relative Strength Index (RSI) and the Stochastic Oscillator are popular tools for identifying these conditions.
- An RSI level of 80 or above is considered overbought, while an RSI level of 30 or below is considered oversold.
- On a stochastic graph, readings within the 80-100 range are considered overbought, while readings between 0-20 are considered oversold.
- Bollinger Bands can also be used to identify overbought and oversold conditions.
Overbought and oversold levels are often a result of overreactions to news and market events.
Remember, while indicators can provide valuable insights, they should not be used in isolation. Always consider other factors and use multiple indicators.
Combining trend analysis with overbought/oversold indicators provides a comprehensive view of market conditions.