Technical Analysis
-
%22%20transform%3D%22translate(.8%20.8)%20scale(1.52344)%22%20fill-opacity%3D%22.5%22%3E%3Cellipse%20fill%3D%22%230b5e9e%22%20cx%3D%22177%22%20cy%3D%2259%22%20rx%3D%2269%22%20ry%3D%2243%22%2F%3E%3Cellipse%20fill%3D%22%231b0800%22%20cx%3D%2234%22%20cy%3D%22134%22%20rx%3D%2250%22%20ry%3D%2250%22%2F%3E%3Cellipse%20fill%3D%22%23150c00%22%20rx%3D%221%22%20ry%3D%221%22%20transform%3D%22matrix(-35.54044%2043.33084%20-20.82037%20-17.0771%2098.4%207.3)%22%2F%3E%3Cellipse%20fill%3D%22%2302559b%22%20rx%3D%221%22%20ry%3D%221%22%20transform%3D%22rotate(-172.8%2013.2%2025.6)%20scale(32.43255%2036.97289)%22%2F%3E%3C%2Fg%3E%3C%2Fsvg%3E)

Line Charts Trading: How They Look & When They Are Useful
A line chart is the simplest type of chart used in trading, representing the closing prices of a trading instrument…
Read More » -
%22%20transform%3D%22translate(.8%20.8)%20scale(1.52344)%22%20fill-opacity%3D%22.5%22%3E%3Cellipse%20fill%3D%22%237c7c7c%22%20rx%3D%221%22%20ry%3D%221%22%20transform%3D%22matrix(-76.396%20-15.03992%2047.02044%20-238.84249%20239.5%20109.5)%22%2F%3E%3Cellipse%20fill%3D%22%23d4d4d4%22%20cx%3D%2240%22%20cy%3D%2240%22%20rx%3D%22133%22%20ry%3D%22133%22%2F%3E%3Cellipse%20fill%3D%22%23fbfbfb%22%20cx%3D%2225%22%20rx%3D%2250%22%20ry%3D%2238%22%2F%3E%3Cellipse%20fill%3D%22%236c6c6c%22%20rx%3D%221%22%20ry%3D%221%22%20transform%3D%22rotate(5.2%20-768.5%202742.8)%20scale(14.94883%20158.56303)%22%2F%3E%3C%2Fg%3E%3C%2Fsvg%3E)
How To Identify Overbought Or Oversold Market Conditions
Two key terms that often come up are ‘overbought’ and ‘oversold’. These terms refer to market conditions that are ripe…
Read More » -
%22%20transform%3D%22translate(.8%20.8)%20scale(1.52344)%22%20fill-opacity%3D%22.5%22%3E%3Cellipse%20fill%3D%22%23919191%22%20rx%3D%221%22%20ry%3D%221%22%20transform%3D%22matrix(-180.64558%207.65637%20-1.1301%20-26.66371%20122%2045.2)%22%2F%3E%3Cellipse%20fill%3D%22%23565656%22%20cx%3D%22139%22%20cy%3D%22115%22%20rx%3D%22255%22%20ry%3D%2237%22%2F%3E%3Cellipse%20fill%3D%22%23565656%22%20rx%3D%221%22%20ry%3D%221%22%20transform%3D%22matrix(.78252%2012.48808%20-29.38916%201.84156%2062.8%2074.5)%22%2F%3E%3Cellipse%20fill%3D%22%23575757%22%20cx%3D%22115%22%20cy%3D%228%22%20rx%3D%22105%22%20ry%3D%2213%22%2F%3E%3C%2Fg%3E%3C%2Fsvg%3E)

The Limitations Of The MACD Indicator
The Moving Average Convergence Divergence (MACD) is a powerful tool for technical analysis, but it’s essential to understand its limitations…
Read More » -
%22%20transform%3D%22translate(.8%20.8)%20scale(1.52344)%22%20fill-opacity%3D%22.5%22%3E%3Cellipse%20fill%3D%22%2346ac29%22%20cx%3D%2290%22%20cy%3D%229%22%20rx%3D%2262%22%20ry%3D%2238%22%2F%3E%3Cellipse%20fill%3D%22%23a29236%22%20rx%3D%221%22%20ry%3D%221%22%20transform%3D%22rotate(-179.2%2059.4%2063.7)%20scale(74.55971%2035.33623)%22%2F%3E%3Cellipse%20fill%3D%22%2362899a%22%20cx%3D%22223%22%20cy%3D%2249%22%20rx%3D%2284%22%20ry%3D%2284%22%2F%3E%3Cellipse%20fill%3D%22%23bdc763%22%20rx%3D%221%22%20ry%3D%221%22%20transform%3D%22rotate(113.1%20-10.3%2028.4)%20scale(44.02255%2033.17234)%22%2F%3E%3C%2Fg%3E%3C%2Fsvg%3E)

Common Ways To Use The MACD Indicator In Trading
Three Ways How Traders Utilize The MACD Indicator The MACD indicator is a versatile tool that can be used in…
Read More » -
%22%20transform%3D%22translate(.8%20.8)%20scale(1.52344)%22%20fill-opacity%3D%22.5%22%3E%3Cellipse%20fill%3D%22%238b918f%22%20cx%3D%22192%22%20cy%3D%2284%22%20rx%3D%2248%22%20ry%3D%2248%22%2F%3E%3Cellipse%20fill%3D%22%237c1d3d%22%20rx%3D%221%22%20ry%3D%221%22%20transform%3D%22rotate(8.4%20-884.6%20502.3)%20scale(42.44523%2052.18358)%22%2F%3E%3Cellipse%20fill%3D%22%238d9190%22%20cx%3D%22140%22%20cy%3D%2283%22%20rx%3D%2230%22%20ry%3D%2232%22%2F%3E%3Cellipse%20fill%3D%22%23868787%22%20cx%3D%22244%22%20cy%3D%2283%22%20rx%3D%22135%22%20ry%3D%2232%22%2F%3E%3C%2Fg%3E%3C%2Fsvg%3E)
Ready For The Market Turnaround: The Head and Shoulders Pattern
Welcome to our comprehensive guide on the head and shoulders pattern, a powerful chart pattern that can assist traders in…
Read More » -
%22%20transform%3D%22translate(.8%20.8)%20scale(1.52344)%22%20fill-opacity%3D%22.5%22%3E%3Cellipse%20fill%3D%22%23b8ab9b%22%20rx%3D%221%22%20ry%3D%221%22%20transform%3D%22matrix(17.35242%20-42.14364%2067.12205%2027.63715%20138%2091)%22%2F%3E%3Cellipse%20fill%3D%22%231d2c2c%22%20cx%3D%22137%22%20cy%3D%2211%22%20rx%3D%22255%22%20ry%3D%2215%22%2F%3E%3Cellipse%20fill%3D%22%23102b27%22%20rx%3D%221%22%20ry%3D%221%22%20transform%3D%22matrix(-38.82509%20-2.21106%201.66952%20-29.31604%2048%20143)%22%2F%3E%3Cellipse%20fill%3D%22%23c1631d%22%20rx%3D%221%22%20ry%3D%221%22%20transform%3D%22matrix(-1.6428%2023.49308%20-32.36243%20-2.263%20184%20138.4)%22%2F%3E%3C%2Fg%3E%3C%2Fsvg%3E)

Turning the Tide: A Trader’s Guide to Spotting and Trading Reversal Patterns
Reversal patterns are a fundamental aspect of technical analysis for traders. These patterns provide crucial insights into potential trend changes…
Read More » -
%22%20transform%3D%22translate(.8%20.8)%20scale(1.52344)%22%20fill-opacity%3D%22.5%22%3E%3Cellipse%20fill%3D%22%23beabb2%22%20cx%3D%22194%22%20rx%3D%2268%22%20ry%3D%2268%22%2F%3E%3Cellipse%20fill%3D%22%23132922%22%20rx%3D%221%22%20ry%3D%221%22%20transform%3D%22matrix(32.40262%2076.5319%20-114.66328%2048.54695%2051.4%20143)%22%2F%3E%3Cpath%20fill%3D%22%23b6627f%22%20d%3D%22M251.9%2020.4l57.3%20149.3-83%2032-57.4-149.4z%22%2F%3E%3Cellipse%20fill%3D%22%238d1538%22%20rx%3D%221%22%20ry%3D%221%22%20transform%3D%22matrix(-4.5832%2045.91776%20-99.96788%20-9.97812%200%2011)%22%2F%3E%3C%2Fg%3E%3C%2Fsvg%3E)

Stochastic Indicator Maestro: Technical Analysis With The Oscillator
Welcome to our comprehensive guide on the Stochastic Oscillator, a powerful tool used by traders worldwide to evaluate market momentum…
Read More » -
%22%20transform%3D%22translate(.8%20.8)%20scale(1.52344)%22%20fill%3D%22%23202020%22%20fill-opacity%3D%22.5%22%3E%3Cpath%20d%3D%22M214%2028l12-20%206%2024zM24.6%2082.7L11.1%2064l20.3-14.7L44.9%2068zM186%2067l5.5%2022.2-15.5%203.9-5.5-22.3z%22%2F%3E%3Cellipse%20cx%3D%22125%22%20cy%3D%2273%22%20rx%3D%223%22%20ry%3D%223%22%2F%3E%3C%2Fg%3E%3C%2Fsvg%3E)
Bearish Flags: How To Trade Them With Options
If you’re an options trader looking for profitable trading strategies, understanding bearish flags and how to trade them with options…
Read More » -
%22%20transform%3D%22translate(.8%20.8)%20scale(1.5039)%22%20fill-opacity%3D%22.5%22%3E%3Cellipse%20fill%3D%22%23200d83%22%20rx%3D%221%22%20ry%3D%221%22%20transform%3D%22matrix(5.7091%2026.84358%20-56.63473%2012.0451%20133.7%20145)%22%2F%3E%3Cellipse%20fill%3D%22%2320211c%22%20cx%3D%22216%22%20cy%3D%22115%22%20rx%3D%2231%22%20ry%3D%22255%22%2F%3E%3Cpath%20fill%3D%22%2320211d%22%20d%3D%22M227.2%202L124.9%20123.7-16%20151.3V-9.4z%22%2F%3E%3Cpath%20fill%3D%22%23201361%22%20d%3D%22M132%20111h17v35h-17z%22%2F%3E%3C%2Fg%3E%3C%2Fsvg%3E)
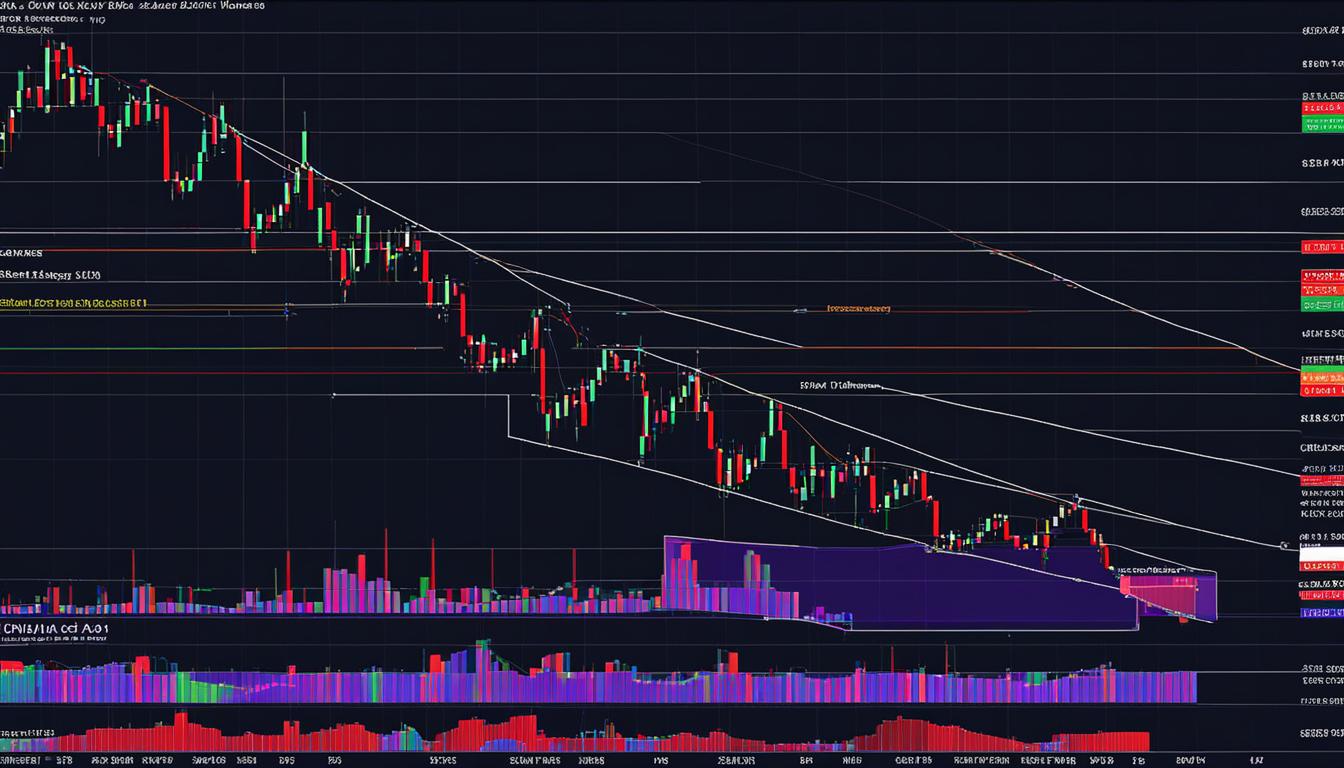
Triangle Chart Pattern Explained
In technical analysis, a triangle is a continuation pattern on a chart that forms a triangle-like shape. There are three…
Read More »
