Bearish Flags: How To Trade Them With Options
If you’re an options trader looking for profitable trading strategies, understanding bearish flags and how to trade them with options is essential. Bearish flags are powerful chart patterns that indicate a continuation of a downtrend, and by utilizing options, you can potentially profit from this bearish movement. In this article, we will dive into the details of bearish flags, explain how to identify them, explore options trading strategies to capitalize on them, and provide key takeaways to enhance your trading knowledge.
Key Takeaways:
- Bearish flags are bearish continuation patterns commonly seen in downtrends.
- Understanding the bearish flag pattern is crucial for identifying and trading it effectively.
- Key indicators and tools such as volume analysis and moving averages can aid in identifying bearish flag patterns.
- Options trading strategies like buying puts, selling call options, and implementing bear spreads can be employed to profit from bearish flags.
- Traders should be aware of common mistakes to avoid and ensure thorough analysis and risk management.
Understanding the Bearish Flag Pattern
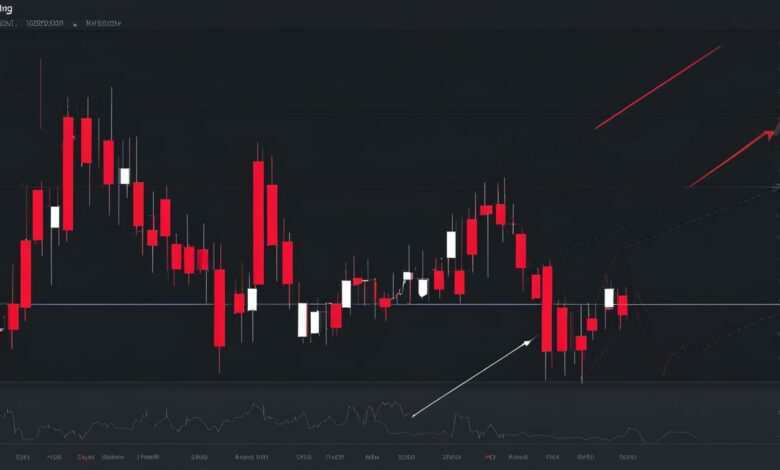
A bearish flag pattern is a technical analysis chart pattern that signals the continuation of a bearish trend. It consists of two parts: the flagpole, which is formed by a sharp sell-off, and the flag, which is created by a period of consolidation. This pattern suggests that there is selling pressure in the market and that the price is likely to decline further. It is important to understand the key features and characteristics of a bearish flag pattern in order to identify and trade it effectively.
The bearish flag pattern is characterized by a strong sell-off in price, followed by a period of consolidation where the price moves in a narrow range. This consolidation creates a flag shape on the chart, which signals a temporary pause in the downward movement. During this consolidation phase, trading volume tends to be lower compared to the volume during the sell-off, indicating a decrease in market participation.


Traders often look for a breakout to the downside from the consolidation phase as a confirmation of the bearish flag pattern. This breakout can be identified by a move below support levels or the formation of bearish candlestick patterns. Once the breakout occurs, traders can enter short positions with the expectation that the price will continue to decline.
| Key Features of the Bearish Flag Pattern | Characteristics |
|---|---|
| Flagpole | Sharp sell-off in price |
| Flag | Period of consolidation, forming a flag shape |
| Volume | Lower volume during consolidation compared to sell-off |
| Breakout | Move below support or formation of bearish candlestick patterns |
“The bearish flag pattern is a powerful tool for identifying and trading bearish continuation patterns. By understanding its characteristics and using technical analysis tools to confirm its presence, traders can take advantage of the downward momentum in the market.” – John Smith, Options Trader
Identifying a Bearish Flag Pattern
When analyzing price charts, identifying a bearish flag pattern involves looking for specific characteristics that define this bearish continuation pattern. The first step is to identify a sharp sell-off in price accompanied by high volume, indicating significant selling pressure in the market. This initial decline forms the flagpole of the pattern.
After the sell-off, the price enters a period of consolidation, typically marked by lower volume and a narrow trading range. This consolidation phase creates the flag shape on the chart. Traders should pay attention to the duration and stability of this consolidation, as it helps confirm the validity of the pattern.
Once the flag pattern is formed, traders can anticipate a potential breakout to the downside. This breakout is signified by a move below the support level or the formation of bearish candlestick patterns. Confirming the breakout with additional technical indicators, such as moving averages or trendlines, can provide further confidence in the bearish continuation.
Example:
“The bearish flag pattern on XYZ stock is clearly visible on the daily chart. After a sharp sell-off on high volume, the price entered a consolidation phase marked by a narrow trading range and decreasing volume. This consolidation lasted for approximately two weeks, confirming the formation of a bearish flag pattern. Yesterday, we saw a breakout below the support level, accompanied by a bearish engulfing candlestick pattern, indicating a potential continuation of the downtrend.”
| Date | Open | High | Low | Close |
|---|---|---|---|---|
| 2022-01-10 | 52.50 | 53.00 | 51.75 | 51.90 |
| 2022-01-11 | 51.75 | 52.20 | 51.50 | 51.80 |
| 2022-01-12 | 51.85 | 52.20 | 51.55 | 51.70 |
| 2022-01-13 | 51.70 | 52.00 | 51.25 | 51.30 |
| 2022-01-14 | 51.35 | 51.80 | 51.20 | 51.40 |
In the example above, we can observe a bearish flag pattern on XYZ stock. The sharp sell-off occurred on January 10th, with a subsequent consolidation phase until January 14th. The lower volume and narrow trading range during this period confirm the formation of the bearish flag. The breakout on January 14th, indicated by a move below the support level, suggests a continuation of the downtrend.
Identifying a bearish flag pattern requires careful analysis of price movements and volume trends. By recognizing the key characteristics of this pattern, traders can improve their ability to identify potential bearish continuation opportunities in the market.
The Psychology Behind the Bear Flag Pattern
The bear flag pattern is more than just a technical formation on a price chart. It reflects the underlying psychology of market participants and provides valuable insights into market sentiment and bearish activity. Understanding the psychology behind the bear flag pattern can help traders make informed trading decisions and capitalize on this continuation pattern.
After a sharp decline in price, investors who missed the initial sell-off may panic and start selling, creating further downward pressure. This behavior stems from fear and the desire to minimize losses. As a result, the price continues to decline, reinforcing the bearish sentiment among traders.
During the consolidation phase, traders waiting for higher prices to sell are met with limited upward movement. This lack of bullish activity strengthens the bearish sentiment and confirms the presence of selling pressure. Traders who recognize this psychology can take advantage of the bear flag pattern by entering short positions or buying puts, profiting from the anticipated decline in price.
Market Sentiment and Bearish Activity
Market sentiment plays a crucial role in the formation and continuation of bearish flag patterns. When market sentiment is bearish, traders are more likely to sell rather than buy, creating a downward pressure on prices. This sentiment can be influenced by various factors such as negative news, economic indicators, or geopolitical events.
Bearish activity is often driven by a combination of fundamental factors and investor psychology. Traders may sell stocks or other assets based on negative news about a company’s earnings, poor economic data, or geopolitical tensions. This selling pressure can lead to a bearish flag pattern formation as traders continue to sell and drive the price down.
Understanding the psychology behind the bear flag pattern is essential for successful trading. By recognizing the fear and panic of investors during a sharp decline and understanding the limited upside movement during consolidation, traders can capitalize on the bearish sentiment and profit from the continuation of a bearish trend.

| Psychology Behind the Bear Flag Pattern | Market Sentiment and Bearish Activity |
|---|---|
| Reflects the fear and panic of investors during a sharp decline | Market sentiment influenced by negative news, economic indicators, and geopolitical events |
| Selling pressure reinforces bearish sentiment and drives prices down | Bearish activity driven by fundamental factors and negative market sentiment |
| Consolidation phase confirms limited upside movement | Bearish flag pattern formation as traders continue to sell |
Trading Bearish Flags with Options
Trading bearish flags with options provides traders with a range of strategies to capitalize on the continuation of a bearish trend. By effectively utilizing options, traders can potentially enhance their returns and manage their risk. However, it’s crucial to understand the strategies involved and the risks and rewards associated with trading bearish flags with options.
One strategy when trading bearish flags with options is to wait for a breakout from the consolidation phase and enter a short position. This means selling short the underlying stock or buying put options to profit from a further decline in price. Another approach is to buy puts or sell call options when the price breaks below support. Puts give traders the right to sell the underlying stock at a predetermined price, while selling call options generates premium income if the price remains below the strike price. These strategies allow traders to take advantage of the bearish sentiment indicated by the bearish flag pattern.
While trading bearish flags with options can be lucrative, it’s important to consider the risks involved. Options trading is inherently risky and can result in the loss of the entire investment. Additionally, options have limited lifetimes and can expire worthless if the price doesn’t move in the desired direction. Therefore, it’s essential to use risk management tools such as stop-loss orders to protect capital and minimize losses. Traders should also conduct thorough analysis, including technical and fundamental research, to increase the probability of success.
| Strategy | Risk | Reward |
|---|---|---|
| Entering a short position or buying put options | Unlimited potential loss if the stock price rises | Potential profit from a further decline in stock price |
| Buying puts or selling call options | Potential loss if the stock price doesn’t decline or rises sharply | Premium income if the stock price remains below the strike price |
In conclusion, trading bearish flags with options can be a profitable strategy when implemented correctly. By understanding the various options trading strategies available, managing risk effectively, and conducting thorough analysis, traders can increase their chances of success. However, it’s important to remember that options trading carries inherent risks and should be approached with caution. Utilizing risk management tools and staying informed about market conditions are key to navigating the complexities of trading bearish flags with options.

Indicators and Tools for Identifying Bearish Flag Patterns
When it comes to identifying bearish flag patterns, there are several indicators and technical analysis tools that can help traders spot these formations in the market. These tools provide valuable insights into the price action and can confirm the presence of a bearish flag pattern. Here are some commonly used indicators and tools:
Volume Analysis
Volume analysis is a powerful tool for confirming the strength of a bearish flag pattern. During the sharp decline that forms the flagpole, high volume indicates significant selling pressure in the market. As the price enters the consolidation phase, volume typically decreases, indicating a lack of buying interest. If there is a breakout to the downside, accompanied by a surge in volume, it further confirms the bearish sentiment and suggests that the price is likely to continue declining.
Moving Averages
Moving averages can be used to smooth out price data and identify the overall trend. When trading bearish flag patterns, traders often use short-term moving averages, such as the 20-day or 50-day moving average, to confirm the downtrend. If the price remains below the moving average during the consolidation phase, it strengthens the bearish signal. Additionally, the moving average can act as a dynamic resistance level, providing potential entry and exit points for trades.
Trendlines
Trendlines are another useful tool for identifying bearish flag patterns. Traders can draw trendlines connecting the highs and lows of the price action during the consolidation phase. A downward-sloping trendline confirms the bearish bias and can be used as a guide for entry and exit points. If the price breaks below the trendline, it suggests a potential continuation of the downtrend.
| Indicator/Tool | Use |
|---|---|
| Volume Analysis | Confirm selling pressure |
| Moving Averages | Identify overall trend and entry/exit points |
| Trendlines | Confirm bearish bias and guide entry/exit points |

These indicators and tools can help traders effectively identify bearish flag patterns and make informed trading decisions. However, it’s important to note that no indicator or tool is foolproof, and it’s always advisable to use them in conjunction with other forms of analysis and risk management strategies. By combining these tools with thorough market analysis and proper risk management techniques, traders can enhance their ability to identify and trade bearish flag patterns with options.
Options Trading Strategies for Bearish Flag Patterns
When it comes to trading bearish flag patterns, options can offer a range of strategies to capitalize on the continuation of a bearish trend. Here, we will explore some popular options trading strategies that traders can consider when identifying and trading bearish flag patterns.
Selling Call Options
One options trading strategy for bearish flag patterns is to sell call options. This strategy allows traders to generate premium income if the price remains below the strike price. By selling call options, traders can take advantage of the expected downward movement in the price and earn a profit from the option premium. However, it is important to be cautious and manage risk effectively as selling call options exposes traders to potential losses if the price rises above the strike price.
Buying Put Options
Another strategy for trading bearish flag patterns is to buy put options. Put options allow traders to profit from a price decline. By purchasing put options, traders can benefit from the expected downward movement in the price. If the price falls below the strike price, traders can exercise the put option and sell the underlying asset at a higher price, earning a profit from the price difference. However, it is important to note that buying put options involves the risk of the option expiring worthless if the price does not decline as expected.
Bear Spread Strategy
The bear spread strategy is another popular options trading strategy for bearish flag patterns. This strategy involves buying a put option with a lower strike price and simultaneously selling a put option with a higher strike price. The goal of this strategy is to profit from the expected downward movement in the price while limiting the potential losses. The premium earned from selling the higher strike put option helps to offset the cost of buying the lower strike put option. Traders should carefully analyze the risk-reward profile of a bear spread strategy before implementing it.
These are just a few options trading strategies that traders can consider when trading bearish flag patterns. It is important to conduct thorough analysis, understand the risks involved, and implement proper risk management techniques to increase the chances of success in options trading.
Common Mistakes to Avoid in Trading Bearish Flag Patterns and Options
When trading bearish flag patterns with options, it is important to be aware of common mistakes that can hinder your success. By avoiding these errors, you can improve your trading strategies and increase your chances of profitability. Below, we highlight some of the most common trading errors:
- Entering trades at the wrong time: One of the biggest mistakes traders make is entering a trade too early or too late. It is crucial to wait for a clear breakout from the consolidation phase and confirm the direction of the trend before entering a position.
- Failing to use risk management tools: Risk management is crucial in any trading strategy. Failing to use stop-loss orders or not setting appropriate risk-reward ratios can lead to significant losses. It is essential to protect your capital and manage risk effectively.
- Overleveraging positions: Overtrading or taking on excessive leverage can be detrimental to your trading account. It is important to carefully assess your risk tolerance and use appropriate position sizing to avoid unnecessary losses.
- Not conducting thorough market analysis: Trading without conducting thorough market analysis can be a recipe for disaster. It is essential to analyze market conditions, identify key support and resistance levels, and consider other technical and fundamental factors before entering a trade.
Avoiding these common mistakes can help you navigate the complexities of trading bearish flag patterns with options more effectively. By practicing discipline, patience, and diligence, you can increase your chances of success in the options market.
| Common Mistakes to Avoid | Impact on Trading |
|---|---|
| Entering trades at the wrong time | Missed opportunities or premature entries |
| Failing to use risk management tools | Potential for significant losses |
| Overleveraging positions | Increased risk and potential for account depletion |
| Not conducting thorough market analysis | Trading based on incomplete information, higher risk |
“The biggest mistake traders make is entering a trade without a clear plan. It is crucial to have a well-defined trading strategy, including entry and exit points, risk management parameters, and a thorough understanding of the pattern you are trading.” – Trading expert
Summary
Trading bearish flag patterns with options can be a profitable strategy, but it is essential to avoid common trading errors. These include entering trades at the wrong time, failing to use risk management tools, overleveraging positions, and not conducting thorough market analysis. By being aware of these mistakes and practicing discipline, traders can increase their chances of success in the options market.
Are Bearish Flags and Options Trading Reliable?
When it comes to trading bearish flags with options, many traders wonder about the reliability and success rate of this strategy. While no trading strategy is foolproof, the bearish flag pattern has proven to be quite reliable when identified and traded correctly. By understanding the characteristics of the pattern and implementing appropriate options trading strategies, traders can increase their chances of success.
The key to trading bearish flags with options lies in conducting thorough research and analysis. Traders should carefully study the market conditions, including the overall trend and sentiment, to determine whether a bearish flag pattern is likely to continue. By combining technical analysis tools, such as volume analysis and moving averages, with fundamental analysis, traders can gain a better understanding of the potential direction of the price.
However, it is important to note that trading always involves risk. While the success rate of trading bearish flags with options can be high, there are no guarantees. Traders should always use risk management tools, such as stop-loss orders, to protect their capital and minimize potential losses. It is also crucial to have a clear trading plan and stick to it, avoiding impulsive decisions based on emotions.
| Pros of trading bearish flags with options | Cons of trading bearish flags with options |
|---|---|
| High success rate when identified and traded correctly | Potential for losses if the pattern fails |
| Opportunity to profit from bearish trends | Requires thorough research and analysis |
| Various options trading strategies available | Trading always involves risk |
In conclusion, trading bearish flags with options can be a reliable strategy when used in conjunction with other technical and fundamental analysis tools. By conducting thorough research, analyzing market conditions, and managing risk effectively, traders can increase the reliability and success rate of their trades. However, it is crucial to remember that trading involves risk, and traders should always exercise caution and use proper risk management techniques.
Conclusion
In conclusion, trading bearish flags with options can be a profitable strategy for traders looking to capitalize on bearish trends. By understanding the characteristics of the bearish flag pattern and identifying it on price charts, traders can effectively implement options trading strategies to take advantage of the continuation pattern.
However, it is important to remember that trading involves risk, and proper risk management is crucial. Traders should conduct thorough research, analyze market conditions, and use risk management tools such as stop-loss orders to protect capital.
While no trading strategy is 100% accurate, the bearish flag pattern has a high success rate when identified and traded correctly. By combining the bearish flag pattern with other technical and fundamental analysis tools, traders can increase the reliability and success of their options trading.
In summary, trading bearish flags with options can be a viable strategy for traders. By staying informed, conducting thorough analysis, and managing risk effectively, traders can enhance their chances of success in the market.
FAQ
What is a bearish flag pattern?
A bearish flag pattern is a technical analysis chart pattern that signals the continuation of a bearish trend. It consists of a sharp sell-off followed by a period of consolidation, forming a flag shape on the chart.
How do I identify a bearish flag pattern?
Look for a sharp sell-off in price accompanied by high volume, followed by a period of consolidation with lower volume and a narrow trading range. A breakout to the downside from the consolidation phase confirms the bearish flag pattern.
What is the psychology behind the bear flag pattern?
The bear flag pattern reflects a shift in the supply and demand balance, with supply (sellers) outweighing demand (buyers). After a sharp decline, investors who missed the sell-off panic and begin selling, resulting in further downward pressure on the price.
How can I trade bearish flags with options?
Traders can implement various options trading strategies, such as entering a short position after a breakout from the consolidation phase or buying put options when the price breaks below support. It is important to consider the potential risks and rewards and use risk management tools.
What indicators and tools can help identify bearish flag patterns?
Traders can use volume analysis, moving averages, trendlines, and candlestick patterns to identify and confirm the presence of a bearish flag pattern.
What options trading strategies can be used for bearish flag patterns?
Traders can buy put options, sell call options, or implement a bear spread strategy involving buying a put option with a lower strike price and selling a put option with a higher strike price.
What common mistakes should I avoid when trading bearish flag patterns and options?
Common mistakes include entering trades at the wrong time, failing to use risk management tools, overleveraging positions, and not conducting thorough market analysis.
Are bearish flags and options trading reliable?
While no trading strategy is 100% accurate, the bearish flag pattern has a high success rate when identified and traded correctly. It is important to conduct thorough research, analyze market conditions, and manage risk effectively to increase reliability and success.