Turning the Tide: A Trader’s Guide to Spotting and Trading Reversal Patterns

Reversal patterns are a fundamental aspect of technical analysis for traders. These patterns provide crucial insights into potential trend changes and play a vital role in successful trading strategies. Understanding reversal patterns is essential for identifying entry and exit points and maximizing profit potential.
At [Your Company Name], we recognize the significance of reversal patterns in trading and the value they bring to traders. In this comprehensive guide, we will explore the different types of reversal patterns, their characteristics, and how to utilize them effectively in your trading strategy.
Throughout this guide, we will delve into the intricacies of reversal patterns, shedding light on various candlestick patterns and chart patterns that traders commonly encounter. We will provide insights into how these patterns inform trading decisions and highlight the importance of recognizing them in a rapidly changing market.
Whether you are a seasoned trader or just starting your trading journey, this guide will equip you with the knowledge and tools necessary to spot and trade reversal patterns with confidence.
Key Takeaways
- Reversal patterns are essential in technical analysis for traders.
- Understanding reversal patterns can improve entry and exit points in trades.
- Reversal patterns can assist in managing risk and maximizing profit potential.
- It’s crucial to consider other factors and use reversal patterns in conjunction with other technical indicators.
- Recognizing reversal patterns is crucial for successful trading.
Defining Reversal Patterns in Trading
Reversal patterns play a crucial role in technical analysis for traders. These patterns indicate a potential change in the price direction of an asset, highlighting shifts from uptrends to downtrends or vice versa. Understanding and recognizing these patterns are essential skills for successful trading.
There are several common types of reversal chart patterns that traders should be familiar with. The first is the head and shoulders pattern, which consists of a peak (the head) and two smaller peaks (the shoulders), signaling a potential trend reversal. Another common pattern is the double top pattern, characterized by two consecutive peaks at a similar price level, indicating a possible reversal from an uptrend to a downtrend. The rounding bottom pattern, on the other hand, is a curved pattern that suggests a shift from a downtrend to an uptrend.
The cup and handle pattern is another reversal pattern to be aware of. It resembles a cup shape followed by a smaller consolidation (the handle), signaling a potential trend reversal. Lastly, the triple bottom pattern consists of three consecutive troughs at a similar price level, indicating a potential reversal from a downtrend to an uptrend.

Table: Common Types of Reversal Chart Patterns
| Pattern | Description |
|---|---|
| Head and Shoulders Pattern | A peak (the head) with two smaller peaks (the shoulders), indicating a potential trend reversal. |
| Double Top Pattern | Two consecutive peaks at a similar price level, suggesting a reversal from an uptrend to a downtrend. |
| Rounding Bottom Pattern | A curved pattern signaling a shift from a downtrend to an uptrend. |
| Cup and Handle Pattern | A cup shape followed by a smaller consolidation (the handle), indicating a potential trend reversal. |
| Triple Bottom Pattern | Three consecutive troughs at a similar price level, suggesting a reversal from a downtrend to an uptrend. |
Recognizing these patterns and understanding their characteristics can provide valuable insights into potential future price movements. Traders can then use this knowledge to make informed decisions and adjust their strategies accordingly.
Spotlight on Reversal Candlestick Patterns
In addition to the chart patterns discussed in the previous section, candlestick patterns are another essential tool for identifying potential trend reversals in trading. These patterns offer valuable insights into market sentiment and can help traders make informed decisions. Let’s explore some of the noteworthy reversal candlestick patterns:
Hammer Pattern
The hammer pattern is a bullish reversal pattern that indicates a potential trend reversal from a downtrend to an uptrend. It consists of a small body with a long lower shadow, resembling a hammer. The presence of a hammer pattern suggests that buyers have entered the market and are pushing the price higher, potentially signaling a shift in momentum.
Engulfing Candle Pattern
The engulfing candle pattern is characterized by a larger candle that completely engulfs the previous candle. This pattern can signify a reversal in the prevailing trend. Bullish engulfing patterns occur when a smaller bearish candle is followed by a larger bullish candle, indicating a potential uptrend. On the other hand, bearish engulfing patterns occur when a smaller bullish candle is followed by a larger bearish candle, suggesting a potential downtrend.
Doji Pattern
The doji pattern is formed when the open and close prices of a candle are extremely close or identical, resulting in a small or non-existent body. This pattern represents indecision in the market and can indicate a potential trend reversal. A doji pattern suggests that buyers and sellers are evenly matched and that a shift in momentum may be imminent.
Evening Star Pattern
The evening star pattern is a bearish reversal pattern that consists of three candles. It starts with a large bullish candle, followed by a small-bodied candle with a gap up or down, and ends with a large bearish candle. This pattern suggests a potential reversal from an uptrend to a downtrend and can serve as a warning sign for traders.
Dark Cloud Cover Pattern
The dark cloud cover pattern is a bearish reversal pattern that occurs when a bullish candle is followed by a bearish candle that opens above the previous close and closes below the halfway point of the preceding bullish candle. This pattern suggests a potential reversal from an uptrend to a downtrend and should be approached with caution.
Piercing Line Pattern
The piercing line pattern is a bullish reversal pattern that occurs when a bearish candle is followed by a bullish candle that opens below the previous close and closes above the halfway point of the preceding bearish candle. This pattern suggests a potential reversal from a downtrend to an uptrend and can provide an opportunity for traders to enter long positions.
By recognizing and understanding these reversal candlestick patterns, traders can gain valuable insights into potential trend reversals. It’s important to note that these patterns should be used in conjunction with other technical analysis tools and indicators to confirm signals and increase the accuracy of trading decisions. Now that we have explored reversal candlestick patterns, let’s delve into how to incorporate these patterns into your trading strategy in the next section.
Utilizing Reversal Patterns in Your Trading Strategy
When it comes to developing a successful trading strategy, incorporating reversal patterns can play a significant role in enhancing your decision-making process. These patterns provide key insights into potential trend reversals, allowing you to time your entry and exit points more effectively. However, it’s important to be aware of common misconceptions about reversal patterns and the possibility of misinterpreting them.
Timing is crucial when utilizing reversal patterns in your trading strategy. By recognizing these patterns early and waiting for confirmation, you can enter trades at more favorable prices, improving your risk-reward ratio and maximizing profit potential. It’s essential to combine reversal patterns with other technical indicators and analysis techniques to increase the accuracy of your timing.
One common misconception about reversal patterns is that they always guarantee a trend reversal. While these patterns indicate a potential shift in price direction, they are not foolproof. False signals can occur, leading to losses if not properly managed. It’s important to exercise caution and use reversal patterns as part of a comprehensive trading strategy.
To avoid misinterpreting reversal patterns, it’s crucial to thoroughly understand the characteristics and significance of each pattern. This requires studying and practicing pattern recognition to develop a keen eye for identifying these formations on price charts. Additionally, it’s important to validate reversal patterns with other technical indicators or fundamental analysis to confirm your trading decisions.
Key Takeaways:
- Utilizing reversal patterns can enhance your trading strategy by improving your timing for entering and exiting trades.
- Timing your entry with reversal patterns can improve your risk-reward ratio and maximize profit potential.
- Be aware of common misconceptions about reversal patterns and exercise caution when relying solely on them.
- Thoroughly understand the characteristics and significance of reversal patterns to avoid misinterpreting them.
- Combine reversal patterns with other technical indicators and analysis techniques for more accurate trading signals.
| Common Misconceptions About Reversal Patterns | Misinterpreting Reversal Patterns |
|---|---|
| 1. Reversal patterns guarantee a trend reversal | 1. Failing to validate reversal patterns with other indicators or analysis techniques |
| 2. Reversal patterns always result in profitable trades | 2. Misidentifying or overlooking subtle variations of reversal patterns |
| 3. Reversal patterns are the sole basis for trading decisions | 3. Ignoring other factors such as market trends and fundamental analysis |
Factors to Consider When Analyzing Potential Trades
When analyzing potential trades, it’s important to consider factors beyond just reversal patterns. While these patterns can provide valuable insights, they should not be relied upon solely for trading success. Here are some additional factors to take into account:
Market Trends:
Understanding the overall trend of the market is crucial. Is it in an uptrend, downtrend, or consolidating? Analyzing the broader market conditions can help you align your trades with the prevailing trend, increasing the likelihood of success.
Volume:
Volume is a key indicator of market participation and can provide confirmation of reversal patterns. Higher volume during a potential reversal can indicate a stronger shift in sentiment, increasing the reliability of the pattern.
Support and Resistance Levels:
Identifying key support and resistance levels can help you determine the potential strength of a reversal pattern. If a reversal pattern aligns with a significant support or resistance level, it may carry more weight and provide a better trading opportunity.
Fundamental Analysis:
Incorporating fundamental analysis into your trading strategy can provide a deeper understanding of the underlying factors that may influence the price of an asset. Factors such as economic indicators, company news, and geopolitical events can impact the success of a trade.
While reversal patterns are valuable tools, it’s essential to consider these additional factors to make more informed trading decisions. By evaluating the broader market context, volume, support and resistance levels, and fundamental factors, you can complement your analysis of reversal patterns and enhance your overall trading strategy.
| Factors to Consider When Analyzing Potential Trades |
|---|
| Market Trends |
| Volume |
| Support and Resistance Levels |
| Fundamental Analysis |
How Reversal Patterns Inform Trading Decisions
Reversal patterns offer valuable information that can inform trading decisions. By recognizing and understanding these patterns, traders can anticipate potential trend reversals and adjust their strategies accordingly. Utilizing reversal patterns can help traders identify optimal entry and exit points, manage risk, and maximize profit potential.
When analyzing a market, traders can look for reversal patterns as signals for potential changes in price direction. For example, the head and shoulders pattern indicates a shift from an uptrend to a downtrend, while the double top pattern suggests a reversal from an uptrend to a downtrend. By identifying these patterns, traders can prepare for potential trend reversals and adjust their positions accordingly.
Reversal patterns provide valuable insights into future price movements and can help traders time their entry and exit points.
Timing is crucial in trading, and reversal patterns can assist in achieving favorable entry points. For instance, the hammer pattern, characterized by a long lower shadow and a small body, can signal a potential bullish reversal. Traders may use this pattern to time their entry and take advantage of a potential upward price movement.
It is important to note that reversal patterns should not be relied upon as the sole indicator for trading decisions. Traders should also consider other factors such as market trends, volume, support and resistance levels, and fundamental analysis. Additionally, combining reversal patterns with other technical indicators can provide further confirmation and increase the accuracy of trading signals.
Using Reversal Patterns to Inform Trading Decisions
To use reversal patterns to inform trading decisions, traders can follow these steps:
- Identify and understand different types of reversal patterns, such as the head and shoulders pattern, double top pattern, or hammer pattern.
- Monitor price movements and look for the formation of these patterns on price charts.
- Confirm the pattern with other technical indicators or analysis techniques to increase the reliability of the signal.
- Based on the pattern and confirmation, determine the appropriate entry and exit points for trades.
- Manage risk by setting stop-loss orders and adjusting positions as the trade progresses.
By following these steps and incorporating reversal patterns into their trading strategies, traders can make more informed and precise decisions in the market.

Risks and Limitations of Reversal Patterns in Trading
While reversal patterns are a valuable tool in technical analysis, it’s important to be aware of the risks and limitations associated with relying solely on these patterns for trading success. Understanding these risks can help traders make more informed decisions and mitigate potential losses.
One major risk of relying on reversal patterns is the possibility of false signals. Reversal patterns are based on historical price data and patterns, but they are not infallible indicators of future price movements. Market volatility, unexpected news events, and other factors can lead to false or failed reversal patterns, resulting in inaccurate trading signals.
Another limitation of reversal patterns is the potential for market volatility to disrupt their effectiveness. Sudden and significant price movements can make it challenging to accurately identify and interpret reversal patterns. Traders should be cautious when relying solely on these patterns during periods of high volatility and consider incorporating other technical indicators and analysis techniques for additional confirmation.
| Limitations of Reversal Patterns | Risks of Relying on Reversal Patterns |
|---|---|
| False signals | Market volatility |
| Potential for failed patterns | Unexpected news events |
| Difficulty in accurately identifying patterns |
Additionally, it’s important to consider that reversal patterns are just one aspect of technical analysis. They should be used in conjunction with other tools and indicators to increase the accuracy of trading signals. Relying solely on reversal patterns may limit a trader’s ability to identify other potential opportunities or risks in the market.
Ultimately, it’s crucial for traders to be aware of the risks and limitations associated with using reversal patterns in their trading strategies. By being mindful of these factors and incorporating a holistic approach to technical analysis, traders can make more informed decisions and increase their chances of success.
How Indicators Can Help Identify Reversal Patterns
When it comes to spotting and trading reversal patterns, incorporating indicators into your analysis can provide valuable insights and confirmation. Indicators are technical tools that can help traders identify potential trend reversals and validate their analysis. By using indicators in conjunction with reversal patterns, you can increase the accuracy of your trading signals and make more informed decisions.
Some popular indicators that can assist in identifying reversal patterns include moving averages, oscillators, and trendlines. Moving averages can help smooth out price data and indicate the overall trend direction. Oscillators, such as the Relative Strength Index (RSI) or Stochastic Oscillator, can identify overbought or oversold conditions, which may precede a price reversal. Trendlines can provide visual cues of support and resistance levels, helping to identify potential trend reversal points.
By combining the signals from these indicators with the patterns identified in the price chart, traders can gain a deeper understanding of the market dynamics and increase their confidence in their trading decisions. It’s important to note that indicators should not be used in isolation but as a complementary tool to reversal patterns. It is essential to consider the overall market conditions and other technical analysis tools to validate the signals provided by the indicators and patterns.
| Indicator | Function |
|---|---|
| Moving Averages | Smooth out price data and indicate trend direction |
| Oscillators | Identify overbought or oversold conditions |
| Trendlines | Identify potential support and resistance levels |
By using these indicators in combination with reversal patterns, traders can improve their overall trading strategy, increase the accuracy of their entries and exits, and minimize the risks associated with false signals. It’s important to remember that no single indicator or pattern can guarantee trading success, and thorough analysis of multiple factors is crucial for making informed trading decisions.
Timing Your Entry with Reversal Patterns
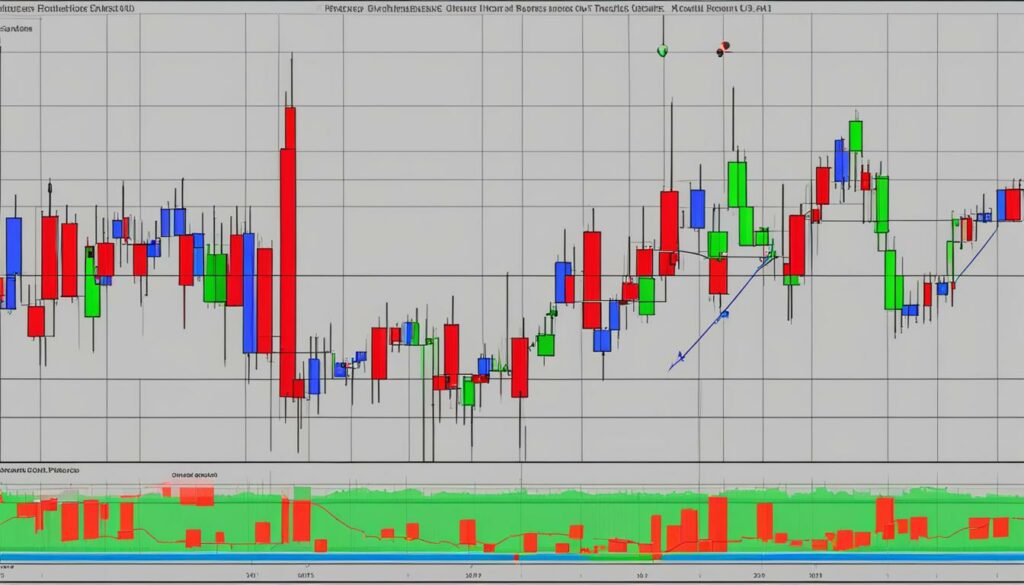
When it comes to trading, timing is everything. Recognizing and understanding reversal patterns can play a crucial role in timing your entry into trades. By identifying these patterns early and waiting for confirmation, you can optimize your entry points and improve your risk-reward ratio. However, it’s important to combine reversal patterns with other technical indicators and analysis techniques for more accurate timing.
One example of a reversal pattern that can help with timing your entry is the head and shoulders pattern. This pattern consists of three peaks, with the middle peak being the highest. Once the neckline is broken, it signals a potential trend reversal. By waiting for the breakout confirmation, traders can enter a trade at a favorable price.
Another useful tool for timing your entry is the use of oscillators. These indicators can help confirm the reversal pattern and provide additional insights into market dynamics. The Relative Strength Index (RSI) and the Stochastic Oscillator are examples of popular oscillators that can be used in conjunction with reversal patterns.
| Reversal Pattern | Timing Strategy |
|---|---|
| Head and Shoulders | Wait for neckline breakout confirmation |
| Double Top/Double Bottom | Wait for price to break below/above the pattern |
| Triple Top/Triple Bottom | Wait for third peak/trough to confirm the pattern |
“Timing your entry with reversal patterns allows you to enter a trade with greater confidence. By combining these patterns with other technical indicators, you can increase the accuracy of your trading signals and maximize your profit potential.” – Trading Masterclass
Remember, timing your entry with reversal patterns is not foolproof. There is always a degree of risk involved in trading, and market conditions can change unexpectedly. It’s important to continually monitor the market and be prepared to adjust your trading strategy accordingly. By staying informed and adapting to market dynamics, you can increase your chances of success.

Key Takeaways
- Timing your entry with reversal patterns is crucial for optimizing your trading strategy.
- Combining reversal patterns with other technical indicators can enhance the accuracy of your trading signals.
- Reversal patterns like the head and shoulders pattern can indicate potential trend reversals.
- Oscillators like the RSI and Stochastic Oscillator can help confirm reversal patterns.
- Remember to always consider market conditions and be prepared to adapt your strategy.
Conclusion
In conclusion, reversal patterns play a crucial role in technical analysis for traders. These patterns provide valuable insights into potential trend reversals, allowing traders to adjust their strategies accordingly. By recognizing and understanding these patterns, traders can improve their entry and exit points, manage risk, and maximize profit potential.
However, it’s important to remember that reversal patterns should not be the sole basis for trading decisions. Other factors such as market trends, volume, support and resistance levels, and fundamental analysis should also be considered. Additionally, it’s important to be aware of the risks and limitations associated with relying solely on reversal patterns.
By combining reversal patterns with other technical indicators and analysis techniques, traders can increase the accuracy of their trading signals. This will help them navigate the market with confidence and increase their chances of success. Mastering the art of spotting and trading reversal patterns is a skill that can significantly enhance a trader’s decision-making process and overall trading strategy.
FAQ
What are reversal patterns in trading?
Reversal patterns in trading indicate a change in the price direction of an asset, signaling a shift from an uptrend to a downtrend or vice versa.
What are some common types of reversal chart patterns?
Some common types of reversal chart patterns include the head and shoulders pattern, double top pattern, rounding bottom pattern, cup and handle pattern, and triple bottom pattern.
What are some noteworthy reversal candlestick patterns?
Some noteworthy reversal candlestick patterns include the hammer pattern, engulfing candle pattern, doji pattern, evening star pattern, dark cloud cover pattern, and piercing line pattern.
How can I incorporate reversal patterns into my trading strategy?
Incorporating reversal patterns into your trading strategy involves recognizing the timing and significance of these patterns to improve your entry and exit points in trades.
What other factors should I consider when analyzing potential trades?
When analyzing potential trades, it is important to consider factors such as market trends, volume, support and resistance levels, and fundamental analysis.
Are there any risks or limitations to relying on reversal patterns for trading success?
Yes, it is important to acknowledge the risks and limitations associated with relying solely on reversal patterns for trading success, including false signals, market volatility, and unexpected events.
Are there any indicators that can help identify reversal patterns?
Yes, indicators such as moving averages, oscillators, and trendlines can be used in conjunction with reversal patterns to increase the accuracy of trading signals.
How can I use reversal patterns to inform my trading decisions?
By recognizing reversal patterns, traders can anticipate potential trend reversals and adjust their strategies accordingly, helping them identify optimal entry and exit points, manage risk, and maximize profit potential.
What is the importance of recognizing reversal patterns?
Recognizing reversal patterns is crucial for traders as they provide key signals for potential trend changes, allowing them to enter trades at favorable positions and avoid missed trading opportunities.
What are the risks and limitations of relying on reversal patterns for trading success?
While reversal patterns are a valuable tool, it is important to acknowledge the risks and limitations associated with relying solely on these patterns, including false signals, market volatility, and unexpected events.
Are there any indicators that can help identify reversal patterns?
Yes, indicators such as moving averages, oscillators, and trendlines can be used in conjunction with reversal patterns to increase the accuracy of trading signals.
How can I time my entry with reversal patterns?
By recognizing reversal patterns early and waiting for confirmation, traders can enter positions at favorable prices, improving the risk-reward ratio and maximizing profit potential.


