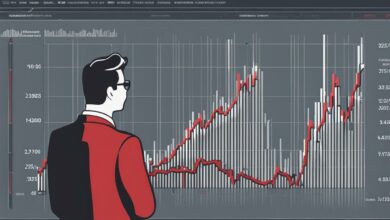
Common Ways To Use The MACD Indicator In Trading

Three Ways How Traders Utilize The MACD Indicator
The MACD indicator is a versatile tool that can be used in a variety of ways to analyze price movements and make informed trading decisions. Here are some common ways traders utilize the MACD indicator:
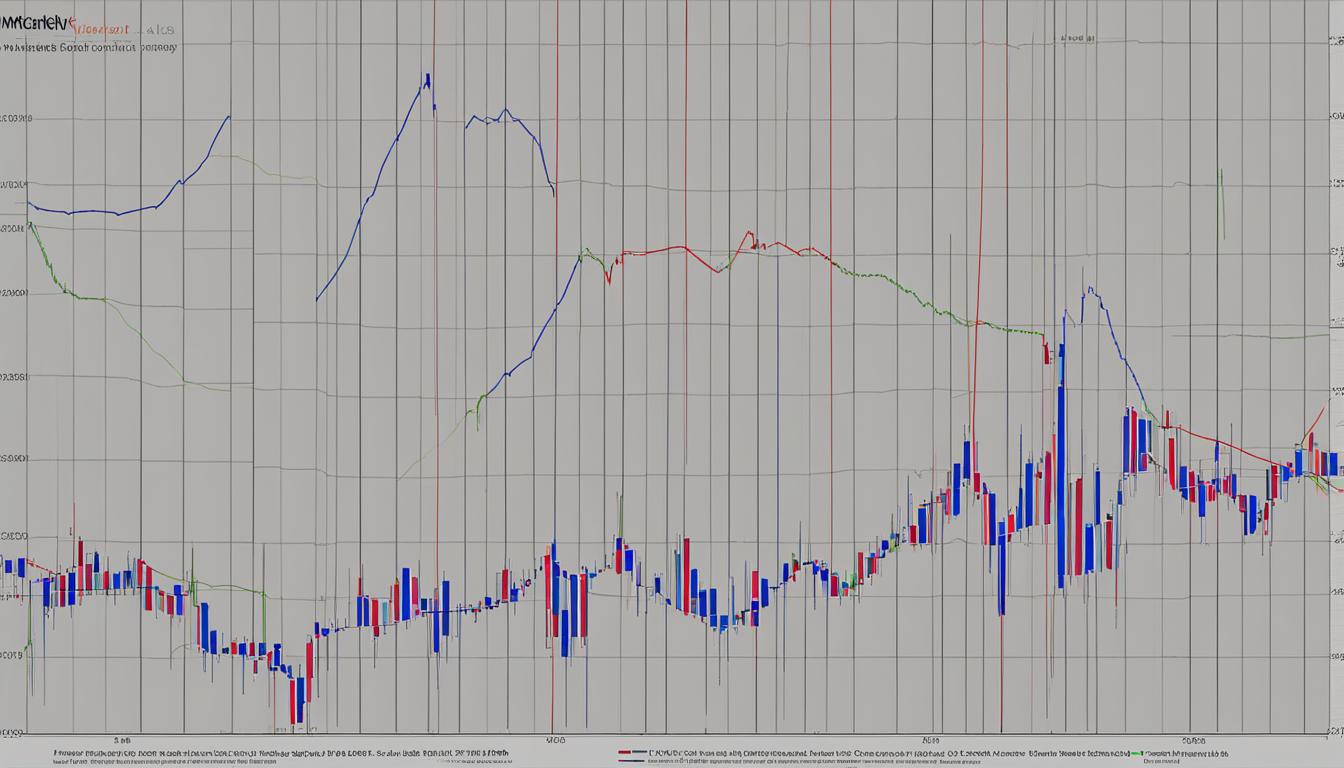
- Identifying trend reversals: The MACD indicator can help traders identify potential trend reversals by analyzing crossovers between the MACD line and signal line. A bullish crossover indicates a potential uptrend, while a bearish crossover suggests a potential downtrend. Traders can use these crossovers as entry and exit signals for their trades.
- Spotting divergence: Divergence occurs when the price of an asset moves in the opposite direction of the MACD indicator. This can indicate a potential trend reversal or a weakening trend. Traders can use divergence to anticipate shifts in market direction and adjust their trading strategy accordingly.
- Determining overbought or oversold conditions: The MACD indicator can be used to identify overbought or oversold conditions in the market. When the MACD line moves far away from the signal line, it indicates that the asset is overbought. Conversely, when the MACD line moves far below the signal line, it suggests that the asset is oversold. Traders can use these indications to anticipate potential price reversals.

Using The MACD In Conjunction With Other Indicators
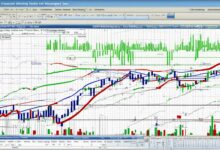
By combining the MACD indicator with tools such as trendlines, support and resistance levels, and candlestick patterns, traders can gain a more comprehensive understanding of the market dynamics.
Using the MACD indicator in conjunction with other technical analysis tools can enhance its effectiveness and provide deeper insights into market trends and potential trading opportunities.
Table: Comparison of MACD Indicator with Other Technical Analysis Tools
| Technical Analysis Tool | Advantages | Limitations |
|---|---|---|
| MACD Indicator | – Provides clear buy and sell signals – Helps identify trends and reversals – Can be customized to suit individual trading strategies | – Lagging nature may result in delayed signals – False signals can occur during choppy or range-bound markets |
| Trendlines | – Provides visual representation of market trends – Helps identify support and resistance levels | – Subjective interpretation may vary among traders – Requires experience to draw accurate trendlines |
| Candlestick Patterns | – Provides insights into market sentiment and price action – Helps identify potential reversals and continuation patterns | – Requires knowledge of various candlestick patterns – False signals may occur in certain market conditions |
It’s important for traders to remember that the MACD indicator, like any other technical analysis tool, should not be used in isolation. It is best used in conjunction with other indicators and analysis techniques to validate trading signals and make well-informed decisions.